Chart updated
on July 26, 2026.
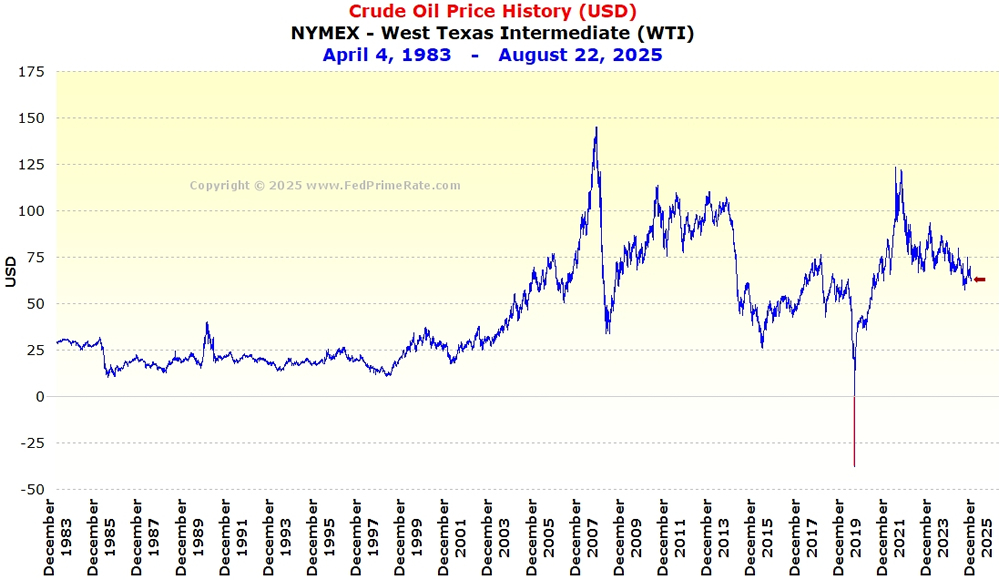
Sources: Crude
Oil Price History (Daily) and EIA.
NB:
The outlier reading of $-37.63
per barrel on April 20, 2020 is not an error.
As global travel declined sharply due to the panic associated
with the COVID-19 virus, demand for crude oil dried up,
and crude prices plummeted. The negative price represents
drillers paying buyers to store surplus crude oil. Oil companies
had to resort to storing excess crude in rented oil tankers.
|