
|
|
||
|
|
|
Standard
& Poor's 500 Index History Chart
|
|
|
|
|
|
|
|
| Prime
Rate |
Current Prime Rate | Prime
Rate History | Prime
Rate Forecast | SITEMAP Certificate of Deposit | Credit Cards | Economy | Life Insurance | LIBOR Rates Student Credit Cards | Prime Rate FAQ | International Prime Rates | Mortgage Rates |
|
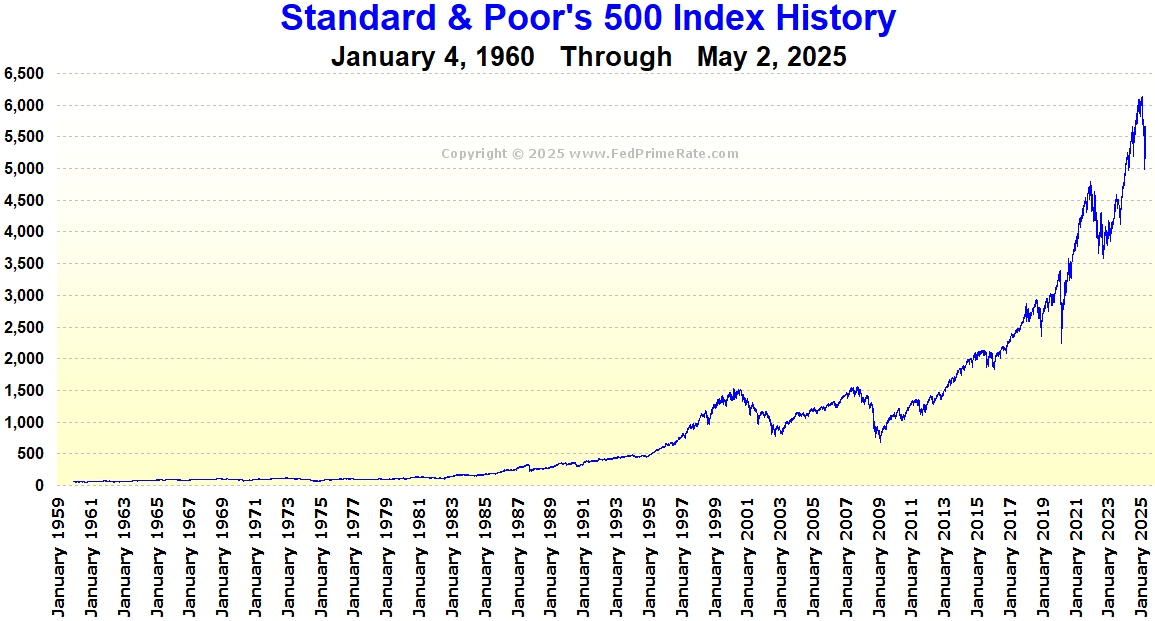
Closing Milestones for The Standard & Poor's 500 Index: S&P 500 Index Closes Above The 100 Mark: June
4, 1968 (100.38) S&P 500 Index Closes Above The 200 Mark: November 21, 1985 (201.41) S&P 500 Index Closes Above The 500 Mark: March
24, 1995 (500.97) S&P 500 Index Closes Above The 1,000 Mark: February
2, 1998 (1,001.27) S&P 500 Index Closes Above The 1,100 Mark: March
24, 1998 (1,105.65) S&P 500 Index Closes Above The 1,200 Mark: December
21, 1998 (1,202.84) S&P 500 Index Closes Above The 1,300 Mark: March
15, 1999 (1,307.26) S&P 500 Index Closes Above The 1,400 Mark: July
9, 1999 (1,403.28) S&P 500 Index Closes Above The 1,500 Mark: March
22, 2000 (1,500.64) S&P 500 Index 2009 Bear-Market Low: March 9,
2009 (676.53) S&P 500 Index Closes Above The 1,600 Mark: May
3, 2013 (1,614.42) S&P 500 Index Closes Above The 1,700 Mark: August
1, 2013 (1,706.87) S&P 500 Index Closes Above The 1,800 Mark: November
22, 2013 (1,804.76) S&P 500 Index Closes Above The 1,900 Mark: May
23, 2014 (1,900.53) S&P 500 Index Closes Above The 2,000 Mark: August
26, 2014 (2,000.02) S&P 500 Index Closes Above The 2,100 Mark: February
17, 2015 (2,100.34) S&P 500 Index Closes Above The 2,200 Mark: November
22, 2016 (2,202.94) S&P 500 Index Closes Above The 2,300 Mark: February
9, 2017 (2,307.87) S&P 500 Index Closes Above The 2,400 Mark: May
15, 2017 (2,402.32) S&P 500 Index Closes Above The 2,500 Mark: September
15, 2017 (2,500.23) S&P 500 Index Closes Above The 2,600 Mark: November
24, 2017 (2,602.42) S&P 500 Index Closes Above The 2,700 Mark: January
3, 2018 (2,713.06) S&P 500 Index Closes Above The 2,800 Mark: January
17, 2018 (2,802.56) S&P 500 Index Closes Above The 2,900 Mark: August
29, 2018 (2,914.04) S&P 500 Index Closes Above The 3,000 Mark: July
12, 2019 (3,013.77) S&P 500 Index Closes Above The 3,100 Mark: November
15, 2019 (3,120.46) S&P 500 Index Closes Above The 3,200 Mark: December
19, 2019 (3,205.37) S&P 500 Index Closes Above The 3,300 Mark: January
16, 2020 (3,316.81) S&P 500 Index Closes Above The 3,400 Mark: August
24, 2020 (3,431.28) S&P 500 Index Closes Above The 3,500 Mark: August
28, 2020 (3,508.01) S&P 500 Index Closes Above The 3,600 Mark: November
16, 2020 (3,626.91) S&P 500 Index Closes Above The 3,700 Mark: December
8, 2020 (3,702.25
) S&P 500 Index Closes Above The 3,800 Mark: January
7, 2021 (3,803.79) S&P 500 Index Closes Above The 3,900 Mark: February
8, 2021 (3,915.59) S&P 500 Index Closes Above The 4,000 Mark: April
1, 2021 (4,019.87) S&P 500 Index Closes Above The 4,100 Mark: April
9, 2021 (4,128.80) S&P 500 Index Closes Above The 4,200 Mark: April
29, 2021 (4,211.47) S&P 500 Index Closes Above The 4,300 Mark: July
1, 2021 (4,319.94) S&P 500 Index Closes Above The 4,400 Mark: July
23, 2021 (4,411.79) S&P 500 Index Closes Above The 4,500 Mark: August
27, 2021 (4,509.37) S&P 500 Index Closes Above The 4,600 Mark: October
29, 2021 (4,605.38) S&P 500 Index Closes Above The 4,700 Mark: November
8, 2021 (4,701.70) S&P 500 Index Closes Above The 4,800 Mark: January
19, 2024 (4,839.81) S&P 500 Index Closes Above The 4,900 Mark: January
29, 2024 (4,927.93) S&P 500 Index Closes Above The 5,000 Mark: February
9, 2024 (5,026.61) S&P 500 Index Closes Above The 5,100 Mark: March
1, 2024 (5,137.08) S&P 500 Index Closes Above The 5,200 Mark: March
20, 2024 (5,224.62) S&P 500 Index Closes Above The 5,300 Mark: May
15, 2024 (5,308.15) S&P 500 Index Closes Above The 5,400 Mark: June
12, 2024 (5.421.03) S&P 500 Index Closes Above The 5,500 Mark: July
2, 2024 (5.509.01) S&P 500 Index Closes Above The 5,600 Mark: July
10, 2024 (5,633.91) S&P 500 Index Closes Above The 5,700 Mark: September
19, 2024 (5,713.64) S&P 500 Index Closes Above The 5,800 Mark: October
11, 2024 (5,815.03) S&P 500 Index Closes Above The 5,900 Mark: November
6, 2024 (5,929.04) S&P 500 Index Closes Above The 6,000 Mark: November 11, 2024 (6,001.35) S&P 500 Index Closes Above The 6,100 Mark: January 23, 2025 (6,118.71) S&P 500 Index Closes Above The 6,200 Mark: June 30, 2025 (6,204.95) S&P 500 Index Closes Above The 6,300 Mark: July 21, 2025 (6,305.60) S&P 500 Index Closes Above The 6,400 Mark: August 12, 2025 (6,445.76) S&P 500 Index Closes Above The 6,500 Mark: August 28, 2025 (6,501.86) S&P 500 Index Closes Above The 6,600 Mark: September 15, 2025 (6,615.28) S&P 500 Index Closes Above The 6,700 Mark: October 1, 2025 (6,711.20) S&P 500 Index Closes Above The 6,800 Mark: October 27, 2025 (6,875.16) S&P 500 Index Closes Above The 6,900 Mark: December 11, 2025 (6,901.00) S&P 500 Index Closes Above The 7,000 Mark: April 15, 2026 (7,022.95) S&P 500 Index Closes Above The 7,100 Mark: April 17, 2026 (7,126.06) &P 500 Index Closes Above The 7,200 Mark: April 30, 2026 (7,209.01) S&P 500 Index Closes Above The 7,300 Mark: May 6 2026 (7,365.12) S&P 500 Index Closes Above The 7,400 Mark: May 11, 2026 (7,412.84) S&P 500 Index Closes Above The 7,500 Mark: May 14, 2026 (7,501.24) S&P 500 Index Closes Above The 7,600 Mark: June 2, 2026 (7,609.78) S&P 500 Index All-Time, Record-High Close: June 2, 2026 (7,609.78) Click Here for The Current S&P 500 Index Value. |
|
Click Here to Jump to The Top of This Document |
|
| Prime
Rate |
Current Prime Rate | Prime
Rate History | Prime
Rate Forecast | SITEMAP Certificate of Deposit | Credit Cards | Economy | Life Insurance | LIBOR Rates Student Credit Cards | Prime Rate FAQ | International Prime Rates | Mortgage Rates CHART: NASDAQ Composite Index | CHART: Dow Jones Industrial Average (DJIA) Dow Jones Industrial Average FULL HISTORY | ! - Deceptive Websites - ! NASDAQ Composite Index FULL HISTORY S & P 500 Index FULL HISTORY | ! - SCAMS - ! | ! - SCAM - ! | NYMEX WTI Crude Oil Price History CHART: NYMEX WTI Crude Oil Price History |
|
Click Here to Jump to The Top of This Document |
|
 |
| Privacy Policy | copyright © 2026 FedPrimeRate.comSM | |
| |
||
|
This website is neither affiliated nor associated with |
||