
|
|
||
|
|
|
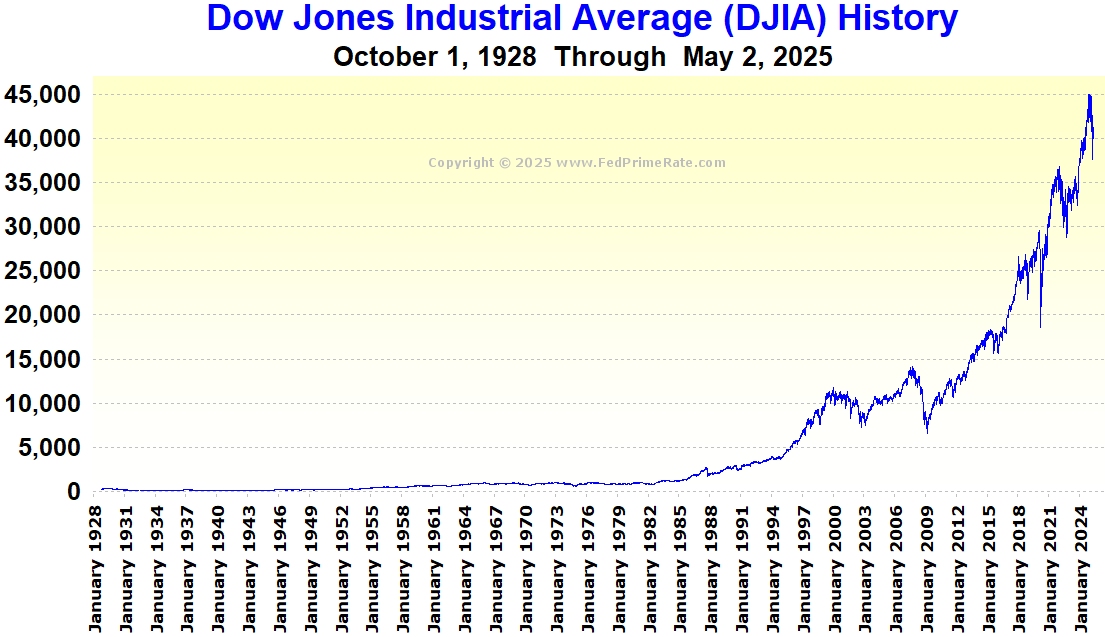
Dow Jones
Industrial Average (DJIA)
|
|
|
Source: DJIA History (Daily.) |
|
|
|
|
| Prime
Rate |
Current Prime Rate | Prime
Rate History | Prime
Rate Forecast | SITEMAP Certificate of Deposit | Credit Cards | Economy | Life Insurance | LIBOR Rates Student Credit Cards | Prime Rate FAQ | International Prime Rates | Mortgage Rates |
|
|
DJIA Closes Above the 1,000 Mark: November 14, 1972 (1,003.16) DJIA Closes Above the 2,000 Mark: January 8, 1987 (2,002.25) DJIA Closes Above the 3,000 Mark: April 17, 1991 (3,004.46) DJIA Closes Above the 4,000 Mark: February 23, 1995 (4,003.33) DJIA Closes Above the 5,000 Mark: November 21, 1995 (5,023.55) DJIA Closes Above the 6,000 Mark: October 14, 1996 (6,010.00) DJIACloses Above the 7,000 Mark: February 13, 1997 (7,022.44) DJIA Closes Above the 8,000 Mark: July 16, 1997 (8,038.88) DJIA Closes Above the 9,000 Mark: May 6, 1998 (9,033.23) DJIA Closes Above the 10,000 Mark: March 29, 1999 (10,006.78) DJIA Closes Above the 11,000 Mark: May 3, 1999 (11,014.69) DJIA Closes Above the 12,000 Mark: October 19, 2006 (12,011.73) DJIA Closes Above the 13,000 Mark: April 25, 2007
(13,089.89) DJIA Closes Above the 14,000 Mark: July 19, 2007
(14,000.41) DJIA 2009 Bear-Market Low: March 9, 2009
(6,507.04) DJIA Closes Above the 15,000 Mark: May 7, 2013
(15,056.20) DJIA Closes Above the 16,000 Mark: November 21,
2013 (16,009.99) DJIA Closes Above the 17,000 Mark: July 3, 2014
(17,068.26) DJIA Closes Above the 18,000 Mark: December 23,
2014 (18,024.17) DJIA Closes Above the 19,000 Mark: November 22,
2016 (19,023.87) DJIA Closes Above the 20,000 Mark: January 25,
2017 (20,068.51) DJIA Closes Above the 21,000 Mark: March 1, 2017
(21,115.55) DJIA Closes Above the 22,000 Mark: August 2, 2017
(22,016.04) DJIA Closes Above the 23,000 Mark: October 18,
2017 (23,157.60) DJIA Closes Above the 24,000 Mark: November 30,
2017 (24,272.35) DJIA Closes Above the 25,000 Mark: January 4, 2018
(25,075.13) DJIA Closes Above the 26,000 Mark: January 17,
2018 (26,115.65) DJIA Closes Above the 27,000 Mark: July 11, 2019
(27,088.08) DJIA Closes Above the 28,000 Mark: November 15,
2019 (28,004.89) DJIA Closes Above the 29,000 Mark: January 15,
2020 (29,030.22) DJIA Closes Above the 31,000 Mark: January 7, 2021
(31,041.13) DJIA Closes Above the 31,300 Mark: February 8,
2021 (31,385.76) DJIA Closes Above the 31,400 Mark: February 10,
2021 (31,437.80) DJIA Closes Above the 31,500 Mark: February 16,
2021 (31,522.75) DJIA Closes Above the 31,600 Mark: February 17,
2021 (31,613.02) DJIA Closes Above the 31,900 Mark: February 24,
2021 (31,961.86) DJIA Closes Above the 33,000 Mark: Mar 17, 2021
(33,015.37) DJIA Closes Above the 34,000 Mark: April 15, 2021
(34,035.99) DJIA Closes Above the 35,000 Mark: July 23, 2021
(35,061.55) DJIA Closes Above the 36,000 Mark: November 2,
2021 (36,052.63) DJIA Closes Above the 37,000 Mark: December 13,
2023 (37,090.24) DJIA Closes Above the 38,000 Mark: January 22,
2024 (38,001.81) DJIA Closes Above the 39,000 Mark: February 22,
2024 (39,069.11) DJIA Closes Above the 40,000 Mark: May 17, 2024
(40,003.59) DJIA Closes Above the 41,000 Mark: July 17, 2024
(41,198.08) DJIA Closes Above the 42,000 Mark: September 19,
2024 (42,025.19) DJIA Closes Above the 43,000 Mark: October 14,
2024 (43,065.22) DJIA Closes Above the 44,000 Mark: November 11,
2024 (44,293.13) DJIA Closes Above the 45,000 Mark: December 4,
2024 (45,014.04) DJIA Closes Above the 46,000 Mark: September 11,
2025 (46,108.00) DJIA Closes Above the 47,000 Mark: October 24,
2025 (47,207.12) DJIA Closes Above the 48,000 Mark: November 12,
2025 (48,254.82) DJIA Closes Above the 49,000 Mark: January 6, 2026
(49,462.08) DJIA Closes Above the 50,000 Mark: February 6,
2026 (50,115.67) DJIA Closes Above the 51,000 Mark: May 29, 2026
(51,032.46) DJIA Closes Above the 52,000 Mark: June 29, 2026
(52,182.74) DJIA Closes Above the 53,000 Mark: July
6, 2026 (53,055.91) DJIA All-Time, Record-High Close: July 6, 2026
(53,055.91) |
|
 |
|
Click Here to Jump to The Top of This Document |
|
| Prime
Rate |
Current Prime Rate | Prime
Rate History | Prime
Rate Forecast | SITEMAP Certificate of Deposit | Credit Cards | Economy | Life Insurance | LIBOR Rates Student Credit Cards | Prime Rate FAQ | International Prime Rates | Mortgage Rates Dow Jones Industrial Average FULL HISTORY | NASDAQ Composite Index FULL HISTORY S & P 500 Index FULL HISTORY | NYMEX WTI Crude Oil Price History - Deceptive Websites - | CHART: NASDAQ Composite Index | CHART: S & P 500 Index CHART: NYMEX WTI Crude Oil Price History | ! - SCAMS - ! | ! - SCAM - ! My Uncle Got Sucked Into A "Home Depot" Phishing Scam QUESTIONS & COMMENTS | New York City Rent Is Too High! |
|
Click Here to Jump to The Top of This Document |
| Privacy Policy | copyright © 2026 FedPrimeRate.comSM | |
| |
||
|
||
|
This website is neither affiliated nor associated with |
||